
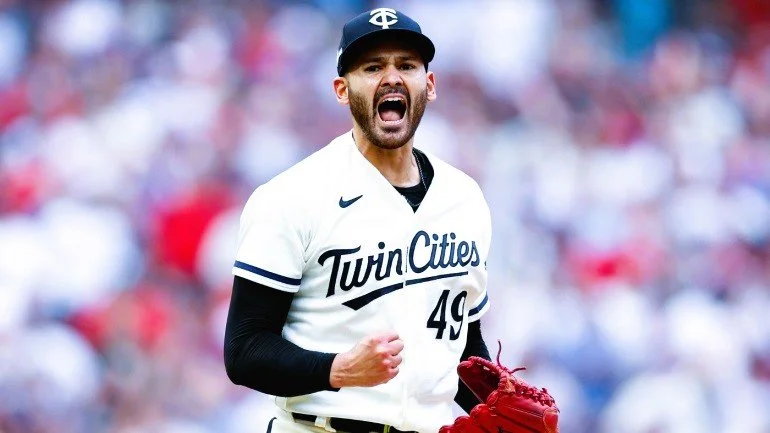
When Should a Team Save its Ace for Game 2?
Game 1 of a playoff series; matchup of aces, and an electric pitchers’ duel coming up. Whether it's a three-game Wild Card Series, five-game Division Series, or seven-game Championship or World Series, seizing victory in Game 1 and exerting pressure on your opponent is vital.
It seems optimal to have your ace take the mound for that start, granting your team the flexibility to bring him back earlier in the series, and perhaps even from the bullpen in a critical do-or-die scenario. However, can there be exceptions to this conventional philosophy? If Game 1 entails facing off against an elite pitcher such as Randy Johnson, Pedro Martinez, or Jacob DeGrom, could it be wiser to hold your ace for Game 2 to enhance your overall series prospects?
In this analysis, I will explore how a team can alternatively structure its playoff pitching rotation to maximize its chance of winning the series.
Photo Credit: Jeff Zelevansky/Icon SMI

When Will Usain Bolt’s 100m Record Be Broken?
The 100m sprint certainly isn’t a ball sport, but the race that determines the title of Fastest Man on Earth definitely deserves an analysis.
It has been over 14 years since Usain Bolt set the 100m world record by clocking in at an astonishing 9.58 seconds at Olympiastadion, Berlin. Back in 2009, many may have expected the progression of record breaking 100m times to continue. However, that trajectory never materialized, and the only individual who has even come close to Bolt's remarkable record time is Bolt himself. This made me wonder: Is it possible to estimate when someone will beat Bolt’s 100m record?
In this analysis, I will delve into the data encompassing 1262 men's 100m outdoor sprints, all electronically timed at under 10.0 seconds and executed with a maximum permissible tailwind of 2.0 m/s (the threshold for record-qualifying times). The aim is to make an estimation of when someone will eventually surpass Bolt's record.
Photo Credit: Sky News
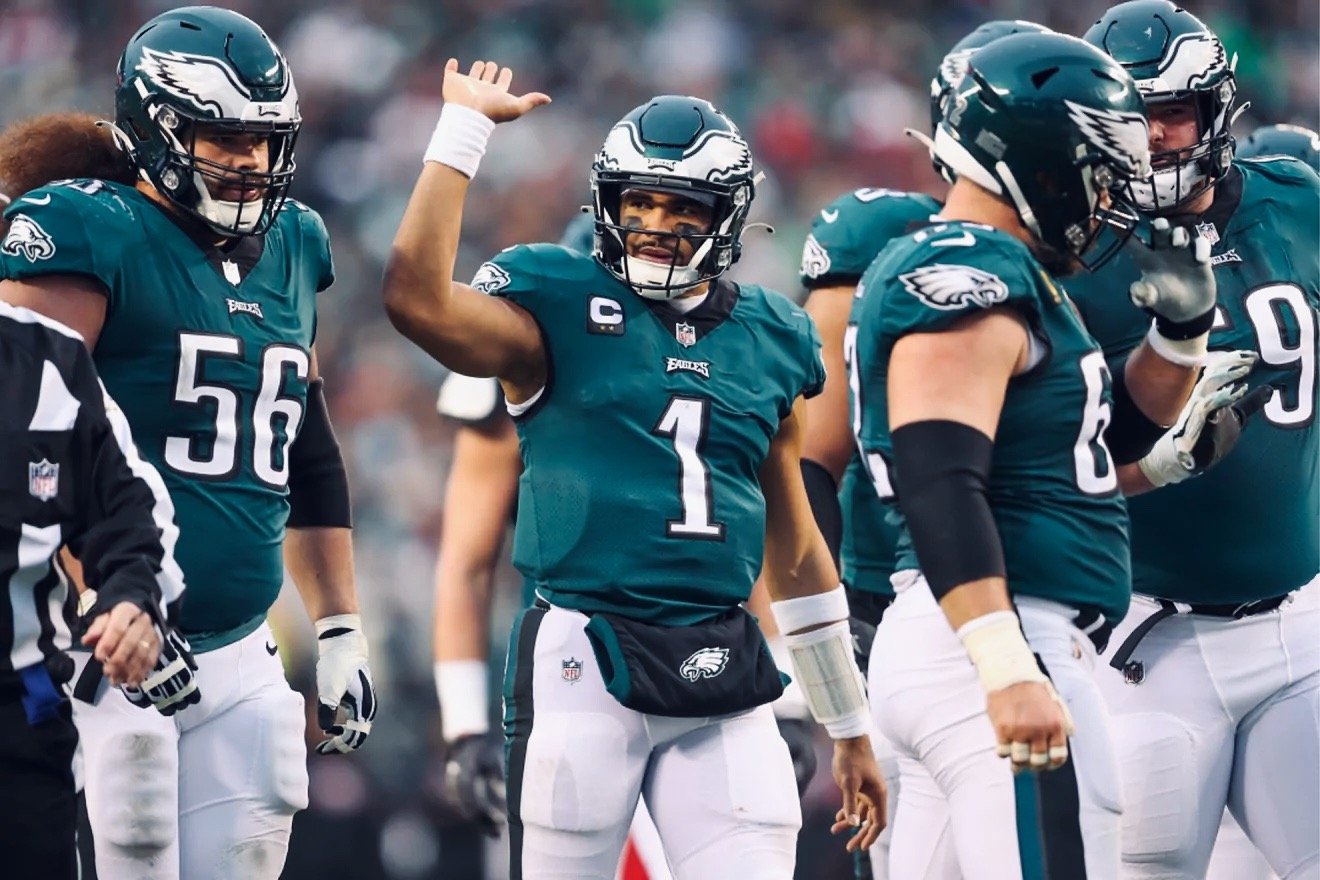
How to Stop The Eagles Offense
The Philadelphia Eagles have been nothing short of remarkable in their last 25 games, boasting an impressive 21-4 record from the start of the last season, including three playoff encounters. The consistent Eagles’ offense averaged 28.1 points per game in the regular season last year and is averaging 28.2 points per game through five games in 2023.
So how can opposing defenses slow down the Eagles’ offense? In this analysis, I will break down the run/pass tendencies of the Eagles' offense, identify their situational strengths and weaknesses, and formulate a strategic approach to stifle their juggernaut attack.
Photo Credit: philadelphiaeagles.com
Paraball Win Share: A New Win Expectancy Tool
Watching the Wild Card Series the last few days, I’ve found myself thinking of win expectancy tools. Baseball has a long history of using empirical formulas to estimate a team's expected win total based on run differentials. This practice dates back to the days of the Bill James Pythagorean Theorem and has undergone refinement over the years. While run differential remains a powerful tool for assessing a team's quality independently of their win-loss record, it's not without limitations.
One notable flaw with the use of run differential is the consideration of blowout games. Every season there are teams that have many more blowout wins than losses, and teams that have many more blowout losses than wins. As a result, these teams have a skewed run differential and a skewed win expectancy. Not all runs should be treated equally; when a position player gives up 6 runs in the 9th to extend his team’s deficit to 16, those runs should be devalued.
This leads me to ask the question: Is there a better way to estimate win expectancy?
Photo Credit: Getty Images

Why Do Curveballs Have a Reverse Platoon Advantage?
A recent post by Tom Tango about platoon splits by pitch type revealed that changeups and curveballs are the two pitches with the most significant reverse platoon advantage - that is, right-handed pitcher changeups and curveballs are more effective against left-handed batters, and left-handed pitcher changeups and curveballs are more effective against right-handed batters. Changeups tail to the arm side and away from batters on the opposite side of the pitcher, so a reverse platoon advantage there is not surprising.
But why are curveballs more effective against batters with the opposite handedness of the pitcher? And how can pitchers use that to optimize their execution of curveballs?
Photo Credit: Yong Kim/Staff Photographer
How Will The Robo Ump Impact Pitch Types and Pitch Locations?
My previous analysis (Who Wants the Robo-Ump? And Who Doesn’t..) focused on which batters, pitchers, and catchers that will be most impacted by having a robot umpire - the automated strike zone (ABS) set to be introduced into the MLB some time in the next few years.
But how will pitch types and pitch locations be impacted by the ABS?
Photo Credit: Jason Szenes/EPA

Who Wants the Robo-Ump? And Who Doesn’t..
The Automated Ball-Strike System (ABS), also referred to as “the robot umpire”, is coming to Major League Baseball within the next few years. ABS will certainly have an impact on catchers, who are currently credited or discredited for Framing Runs based on their ability to pull borderline pitches into the strike zone and hold them for the umpire to believe they were strikes.
But how will ABS impact batters and pitchers? Will superstars no longer get superstar treatment on borderline calls? And who will ABS benefit more - pitchers or hitters?
Photo Credit: Bob Levey/Getty Images

Running Wild: Have We Reached an Inflection Point in the NFL Offensive Strategy Equilibrium?
The NFL is a passing league. Quarterbacks and Wide Receivers have more protection than ever, Running Backs are having lengthy holdouts stemming from under-payment, and everybody loves to watch high scoring shootouts.
But why did the league’s run percentage just have the largest year-to-year increase since 2017, and the second largest year-to-year increase since 2003? Last year’s increase has catapulted the league’s run percentage to the highest level since 2010, leading me to wonder: Have we reached an inflection point in the NFL offensive strategy equilibrium?
Photo Credit: AP Photo/Charlie Riedel

Haaland’s Magical Season: How Good Was He Really, and Can He Do It Again?
Erling Haaland and Manchester City are off to another strong start in the 2023-24 season, collecting all 12 points in their first four fixtures with Haaland already netting six goals, putting him on pace for an absurd 57 goals in the season. Haaland’s 36 goals last season set the all-time single-season EPL record, passing both Andy Cole and Alan Shearer’s marks of 34 goals in a 42-game season, and Mohammed Salah’s mark of 32 goals in a 38-game season.
But how good was Haaland really last season? And can he replicate that success?
Photo Credit: Martin Rickett/PA

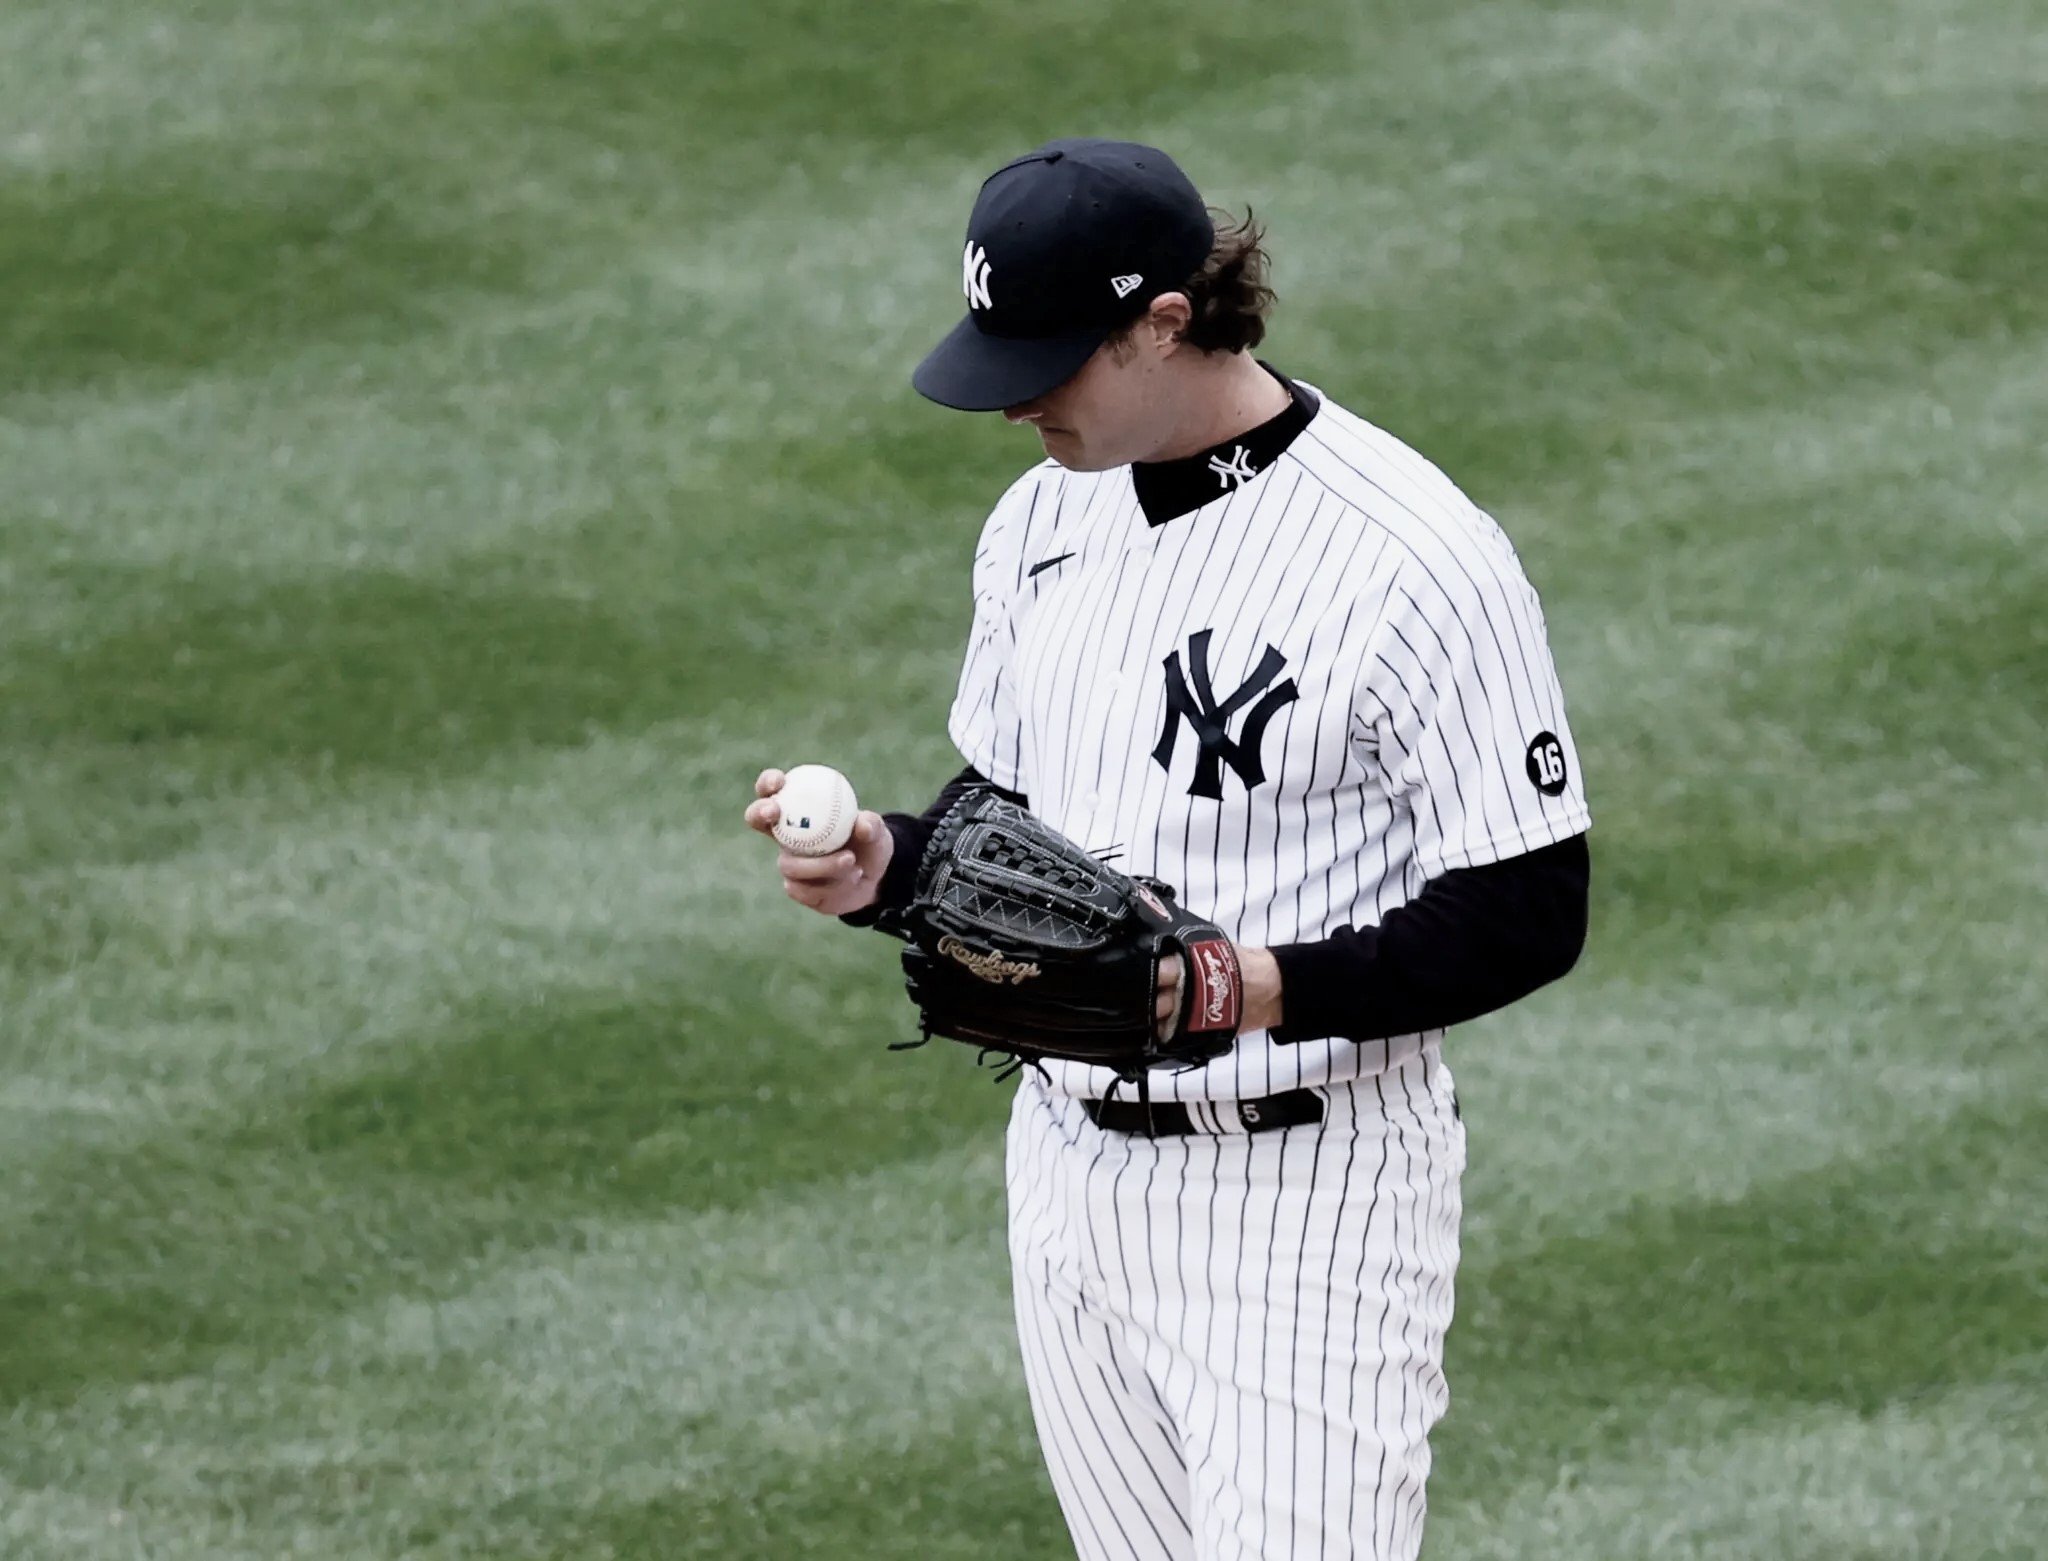
What is Schmidt’s Optimal Pitch Mix?
Yankees pitcher Clarke Schmidt had a successful rookie season in 2022 as a reliever, posting a 3.12 earned run average (ERA) over 57.2 innings pitched. In 2023, when forced into the starting rotation due to injuries to Carlos Rodon, Luis Severino, and Frankie Montas, Schmidt struggled at first—his ERA at the end of April was 6.84. However, since the start of May, Schmidt has adjusted his pitch frequencies and has seen his ERA drop steadily to 4.54. After ace Gerrit Cole, Schmidt has been the most consistent starting pitcher for the Yankees in the second half of the season.
Watching Schmidt this season has me wondering how he can further realize his potential. What is the game theory optimal pitch distribution that he should use?
Photo Credit: AP Photo/Paul Sancya

The Tennis Trade-Off: Should I Go For the Ace or Get the First Serve In?
With the 2023 US Open in full swing, it’s an appropriate time for me to serve up a tennis analysis. Watching #3 ranked Medvedev versus unseeded O’Connell in the 2nd round, my fiancé Christina and I started discussing the importance of the first serve. Medvedev had a curious serving strategy, going for a lot of aces on both his first and second serve. He ended up with 12 aces, 10 double faults, a 54% first serve percentage (first serve in), 81% of first serve points won, and 54% of second serve points won.
The performance sparked my interest: What is the optimal strategy for a men’s tennis player – should he go for the ace or should he get the first serve in?
Photo Credit: USA TODAY

Volpe’s Hitting Under the Microscope
There is no doubt that Yankees’ top prospect Anthony Volpe is having an exciting rookie season. On August 31st, he became the 15th rookie and first Yankees rookie to have 20 homeruns and 20 steals in a season - and the first Yankees shortstop to do so since Derek Jeter in 2004.
However, watching Volpe this season made me aware that his performance is more dependent on the count he is in compared to the average hitter. Let’s dig into the numbers and see how he can improve this.
Photo Credit: Brad Penner/USA TODAY

What Went Wrong with Bader?
After the Yankees’ 3-1 win over the Mariners on June 20th, Harrison Bader’s OPS was at a more than respectable .801, through 98 PAs and 407 pitches seen. However, as of Aug 28th, Bader’s OPS is down to .649. There’s no doubt that the former NL Gold Glove award winner has had a difficult stretch over the past 204 PAs and 718 pitches seen. In fact, Bader’s pitches per plate appearance dropped from 4.15 in the first stretch to 3.52 in the latter stretch. On August 29th, the Yankees placed Bader on waivers.
So what happened to Bader this season? And how can he turn his performance around? To answer this, let’s take a deep look into the numbers.
Photo credit: AP Photo/Noah K. Murray