
How to Quantify Lineup Protection in Baseball
MLB lineup construction is a science that has been developing for over a century. The nuances of ordering hitters include alternating right-handed and left-handed batters to make it more difficult for opposing teams to exploit the platoon advantage, batting your least productive hitter 8th instead of 9th so that the number 9 hitter can act as a second leadoff hitter, and sometimes avoiding batting your best hitter 3rd since that spot is the most likely spot to come up with 2 outs and the bases empty.
In this analysis I’ll discuss lineup protection, that is, the impact that the hitter behind you has on the pitches you face. I’ll use the results of my lineup protection analysis to add another wrinkle to the lineup construction equation.
Photo Credit: Julio Aguilar/Getty Images

Who Are the Best Defensive Outfielders in the MLB?
When evaluating an outfielder’s ability to track and catch fly balls, two of the factors we look at most closely are the outfielder’s jump and the outfielder’s speed. Statcast breaks an outfielder’s jump down into three components: reaction for the first 1.5 seconds, burst for the next 1.5 seconds, and route efficiency for the first 3 seconds.
In this analysis I’ll determine which factors are the most important for an outfielder’s success, and use those factors to project the top defensive outfielders in 2024.
Photo Credit: Miles Kennedy/Phillies

Which Pitching Staff Has the Most Diverse Set of Release Points?
A pitching staff featuring a varied range of release points provides an additional way to unsettle an opposing lineup. In this analysis, I will measure the release point diversity of both right-handed and left-handed pitchers on each team from 2023, to pinpoint the teams that lead the way in this strategy and those that trail behind.
Photo Credit: Jeff Chiu/Associated Press
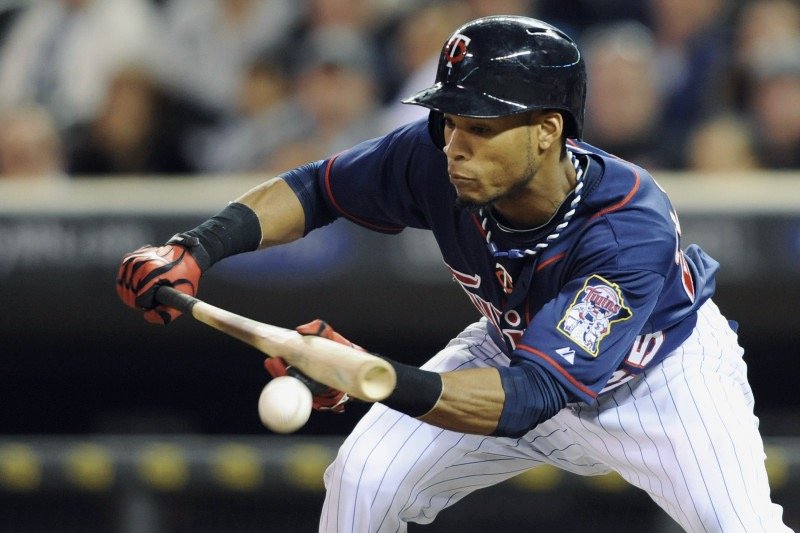
When is it Best to Bunt?
There have been many analyses over the years about the best situations to bunt. Tom Tango’s The Book: Playing the Percentages in Baseball has a thorough analysis of when a team should sacrifice bunt, considering factors such as the on-base percentage of the on-deck hitter and the speed of the batter, as well as the score, game state, and run scoring environment.
In this post, I will take a look at the last two years of bunt attempts (4733 attempts, just under one bunt attempt per game) to assess which situations bunts have been most successful in improving an offense’s run scoring and improving an offense’s win probability. I’ll also assess the pitch characteristics of the pitches that bunts have been most and least successful against.
Photo Credit: Hannah Foslien/Getty Images
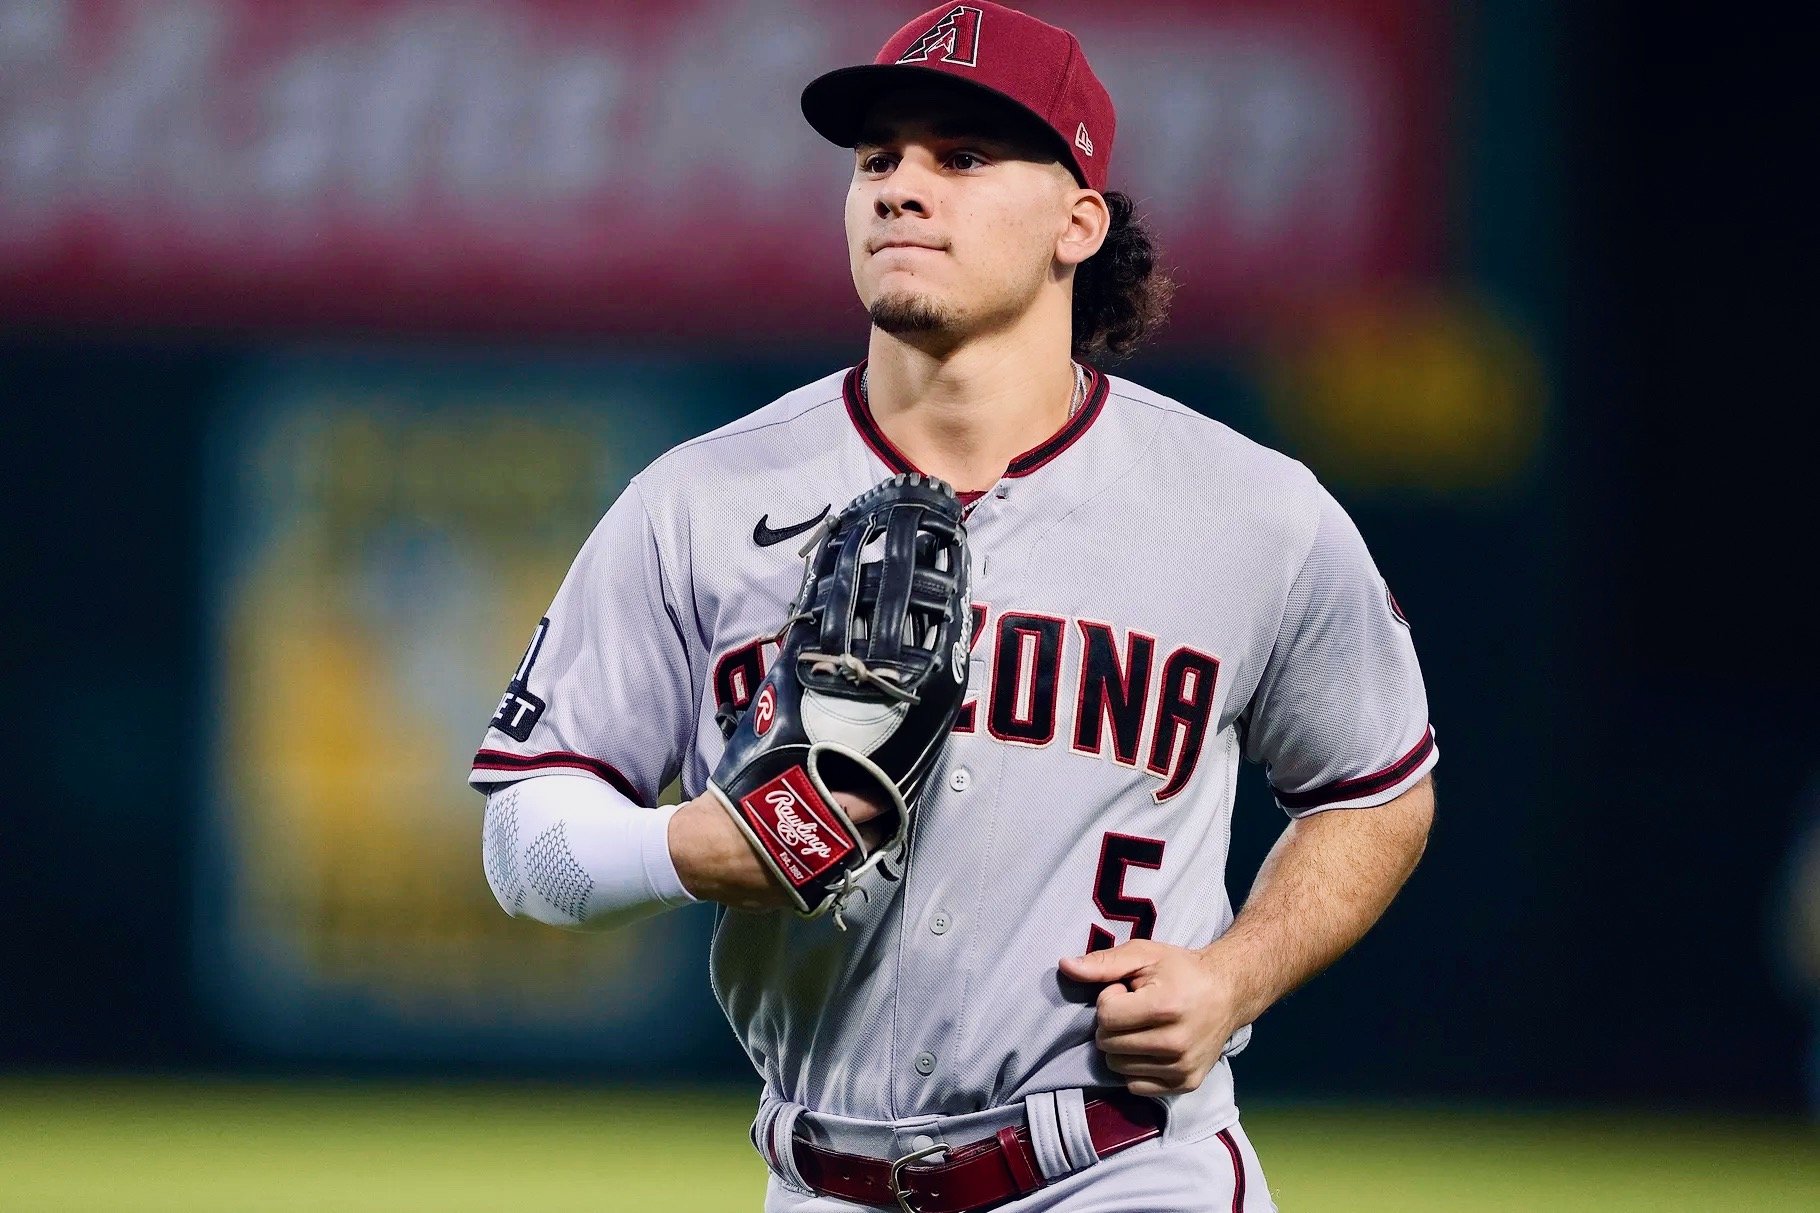
MLB’s Best Defenses, Most Athletic Defenses, and Most Intelligent Defenses
Modern defensive metrics vary significantly in their approach to evaluating fielders. In essence, Fangraphs’ dWAR, which I’ll refer to as fdWAR, is a measure of athleticism, whereas Baseball Reference’s dWAR (let’s call this bdWAR) is a measure of game impact, including a team’s positioning.
In this post I’ll take a look at how the 30 MLB teams ranked in each of bdWAR (overall defensive performance), fdWAR (athleticism), and the difference between bdWAR and fdWAR (positioning value) for the 2023 season.
Photo Credit: Thearon W. Henderson/Getty Images

Measuring Aaron Judge’s True Offensive Value
What are some of the hidden ways in which a superstar hitter helps his team?
Photo Credit: AP Photo/LM Otero

Do Baseball Players Perform Better in Their Walk Years?
I recently came across an article featured on The Society for American Baseball Research (SABR), originally posted in the 2006 Baseball Research Journal, about performance in a player’s walk year, which refers to the final year of a player's contract before they become eligible for free agency. As stated by the article, “conventional wisdom would say they do perform better in the year before they become free agents, at least according to the stereotype of the greedy player, who will put out extra effort only when he will be rewarded financially. Traditional economic theory agrees. Like all rational economic actors, baseball players should produce more of a product when the going price rises.”
The author, however, found that baseball players do not give extra effort that results in an outperformance of their career numbers in their walk years.
Does the same conclusion hold true today?
Photo Credit: Nick Wass/AP Photo

How Good Was Derek Jeter Defensively?
Yankees shortstop Derek Jeter came only one vote shy of a unanimous Hall of Fame selection in 2020. At the end of his 20-year career, Jeter found himself 6th on the all-time hits list and 20th on the all-time oWAR (Offensive Wins Above Replacement) leaderboard, leaving little doubt that the one voter who snubbed him did so either because of a grudge or due to his perception of Jeter’s defense.
In this post, I’ll take a look at how the advanced defensive metrics graded Jeter throughout his career. Furthermore, I will improve upon the metrics by adding a level of complexity: how the strikeout rate of Jeter’s pitching staffs impacted the number of defensive chances he had.
Photo Credit: Michael Ivins/Boston Red Sox/Getty

The Trend in $/WAR for Free Agents
Ben Clemens provided a detailed breakdown of the amount teams paid per WAR (Wins Above Replacement) in free agency between 2018 and 2022. In this analysis, I will expand upon his findings by incorporating data from the 2023 and 2024 free agency periods to examine the broader trend.
Photo Credit: Jayne Kamin-Oncea/USA TODAY Sports

Introducing Pitching Stat LBAbip
BAbip, batting average on balls in play, serves as a valuable statistic for gauging pitchers' luck in the frequency of balls in play (excluding homeruns) that lead to base hits. Conventionally, a pitcher’s BAbip is compared to the league average BAbip when assessing how lucky or unlucky a pitcher has been. In this analysis, I’ll introduce a more sophisticated point of comparison: location-based batting average on balls in play (LBAbip). I will use LBAbip to identify pitchers who are likely to regress to the mean in 2024.
Photo Credit: Adam Glanzman/Getty Images

Free Agent Signings: Should You Sign Quickly or Hold Out for More?
Whether a free agent is looking for a shorter term deal with high average annual value (AAV) or a longer term deal with a larger overall guarantee, should he be looking to sign a deal in November or December, early in the offseason, or should he wait until January or February, as spring training approaches?
Photo Credit: Getty Images
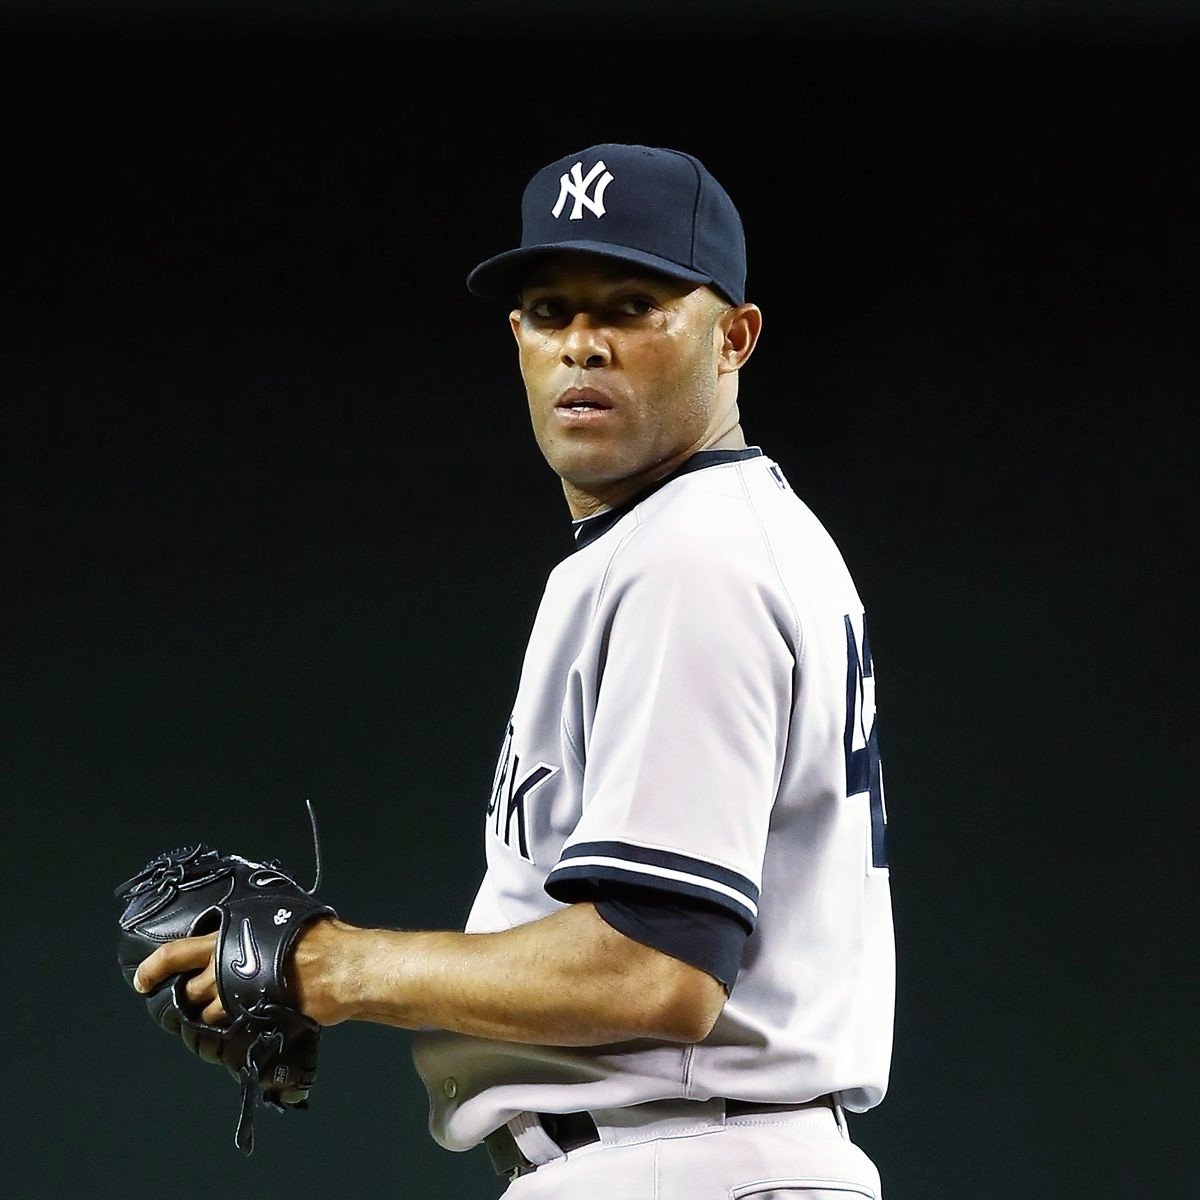
Mariano Rivera: Is He the Greatest Pitcher of All Time?
Mariano Rivera, the only unanimous inductee to the Baseball Hall of Fame, is widely recognized as the greatest relief pitcher of all-time and solidly in the conversation for greatest pitcher overall. But how different from the rest was he really?
Photo Credit: Christian Petersen/Getty Images
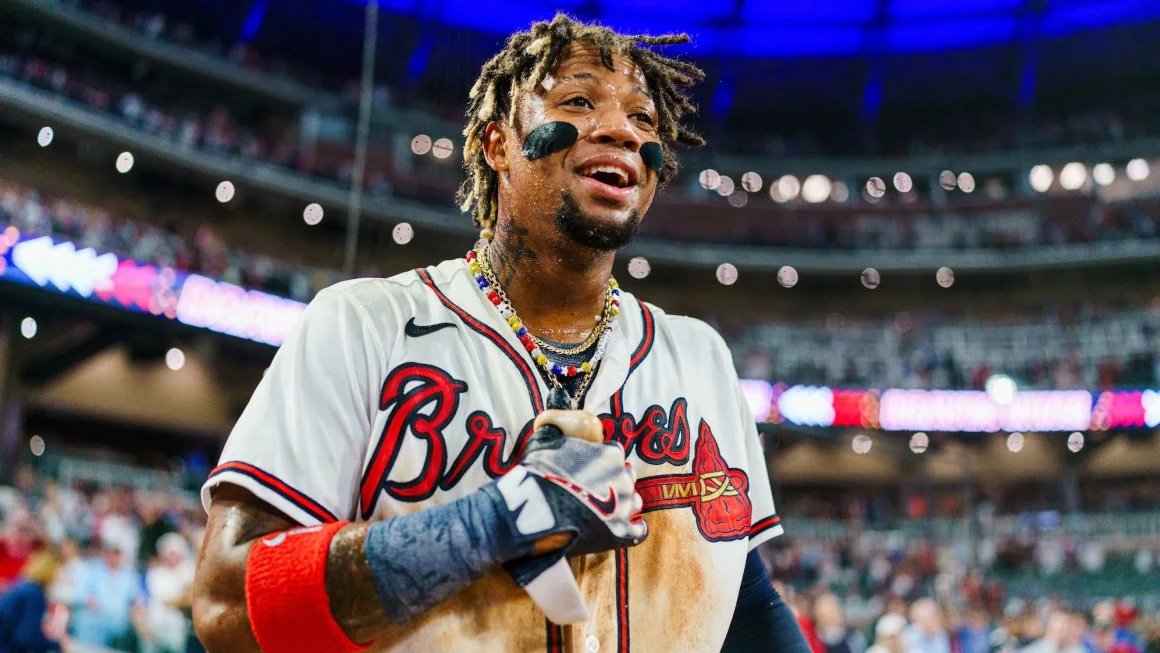
Using Predictive wOBA To Predict 2024 Batting Performance
In a previous post, I proved via correlation that Predictive wOBA (including all batted balls, walks, strikeouts, and hit-by-pitches), is better at predicting Next Season wOBA than both wOBA and xwWOBA. I also showed how a mean-regression technique, resulting in Modified Predictive wOBA, strengthened the model’s predictive power even further.
In this post, I’ll use Modified Predictive wOBA to project performances in the coming baseball season and compare them to Steamer’s 2024 projections.
Photo Credit: Matthew Grimes Jr./Atlanta Braves/Getty Images

What’s The Better Value To a Team: Long-Term Contracts to Elite Hitters or Elite Pitchers?
2024’s free agency started with a bang as the Los Angeles Dodgers signed two-way superstar Shohei Ohtani to a 10-year deal, followed by signing Ohtani’s Japanese countryman Yoshinobu Yamamoto to a 12-year deal.
As the remaining free agents reach deals over the coming weeks, I will take a look a what the relative value of signing an elite hitter to a long-term contract is versus the relative value of signing an elite starting pitcher to a long-term contract.
Photo Credit: Meg Oliphant/Getty Images
How Can We Make Predictive wOBA Even More Predictive?
Last week, Tom Tango introduced the concept of Predictive wOBA, and through correlation analysis, he demonstrated that Predictive wOBA exhibits stronger predictive capabilities for Next Season wOBA than both wOBA and xwOBA. Is there a way to further improve Predictive wOBA?
In this post, I’ll examine the predictive power of a slightly different version of Predictive wOBA, incorporating walks, strikeouts, and hit-by-pitches, along with all batted balls.
Photo Credit: Michael Reaves/Getty Images

The Updated xwFIP
I received a very good comment from reader Light_Saberist on one of my latests posts, in which I compared the predictive powers of xwFIP and FIP.
In order to determine the xHR of a pitcher, xFIP (not to be confused with xwFIP) uses the league average homerun/flyball rate of 10.5% and multiplies that rate by the number of flyballs the pitcher allows. This logic may mitigate some of the luck factors in allowing homeruns and thus strengthen xwFIP as well. I checked that hypothesis, and it was correct!
Photo Credit: Daniel Varnado

The Evolution of MLB’s Run Scoring Environment
Between 2022 and 2023, the league's average wOBA jumped from 0.310 to 0.318 following the implementation of the pitch clock, the ban of the overshift, and the increase in base size. These adjustments not only enhanced the scoring dynamics but also resulted in a reduction of game duration by 24 minutes per game, bringing game time down to 2 hours and 40 minutes, on average.
Despite total attendance nearly rebounding to pre-pandemic levels, as evident from Figure 1 below, it remains considerably below the figures seen in the mid to late 2000s. This trend is primarily attributed to the current lower run-scoring levels in baseball.
In this post, I’ll take a look at the factors that have historically driven change in the league’s run scoring environment, and discuss future league changes that can increase both run scoring and attendance.
Photo Credit: Otto Greule Jr.

Which Batters Can Produce Against the Nastiest Pitches?
Watching the MLB playoffs this year, I started to think about identifying hitters that have the pitch recognition and bat-to-ball skills to make positive contributions against the league’s best pitching.
To investigate this, I’ve looked at pitch location, broken down by Heart, Shadow, Chase and Waste, as defined by Baseball Savant.
Photo Credit: The Daytona Beach News-Journal

The 5.5-Man Pitching Rotation
The MLB starting pitching rotation has been evolving for more than a century: We’ve seen the 3-man rotation, the 4-man rotation, the 5-man rotation, and now even some 6-man rotations.
However, the optimal rotation is the 5.5-man rotation. In this analysis, I’ll explain why.
Photo Credit: Mike Stobe/Getty Images

Comparing The Predictive Powers of xwFIP and FIP
In my previous post, I introduced an enhanced version of FIP - named xwFIP - which incorporates batted ball data and 100% of plate appearances while remaining completely fielding independent. But how is xwFIP’s ability to predict future pitching success? Let’s have a look.
Photo Credit: The Athletic