How Good Was Derek Jeter Defensively?

Photo Credit: Michael Ivins/Boston Red Sox/Getty
Yankees shortstop Derek Jeter came only one vote shy of a unanimous Hall of Fame selection in 2020. At the end of his 20-year career, Jeter found himself 6th on the all-time hits list and 20th on the all-time oWAR (Offensive Wins Above Replacement) leaderboard, leaving little doubt that the one voter who snubbed him did so either because of a grudge or due to his perception of Jeter’s defense.
In this post, I’ll take a look at how the advanced defensive metrics graded Jeter throughout his career. Furthermore, I will improve upon the metrics by adding a level of complexity: how the strikeout rate of Jeter’s pitching staffs impacted the number of defensive chances he had.
Baseball Reference’s dWAR (Defensive Wins Above Replacement) has two main components: fielding run value and positional run value. Prior to the Statcast era, fielding run value was determined largely based on the number of plays (putouts and assists) that a defender made, RF/9 (range factor per 9 innings), relative to the average defender in his position. Positional run value is assigned based on the abundance or scarcity of players who are able to play that position.
When teams strikeout opposing hitters more frequently, their defenders have fewer chances to makes plays and should therefore be compared to an adjusted league average RF/9 rather than the standard league average RF/9 at their position. Hence, building on Baseball Reference’s framework, I will incorporate Team K% (strikeout %), relative to league average K% to create a K-adjusted league average RF/9.
For each of Jeter’s 20 seasons, I’ve calculated the K-adjusted league average RF/9, compared Jeter’s RF/9 to that figure, incorporated the number of innings he played at SS that season, incorporated the league average runs/game to calculate the run value of the marginal out in that season, and finally calculated Jeter’s adjusted defensive run value. The data is arranged in Table 1 below.
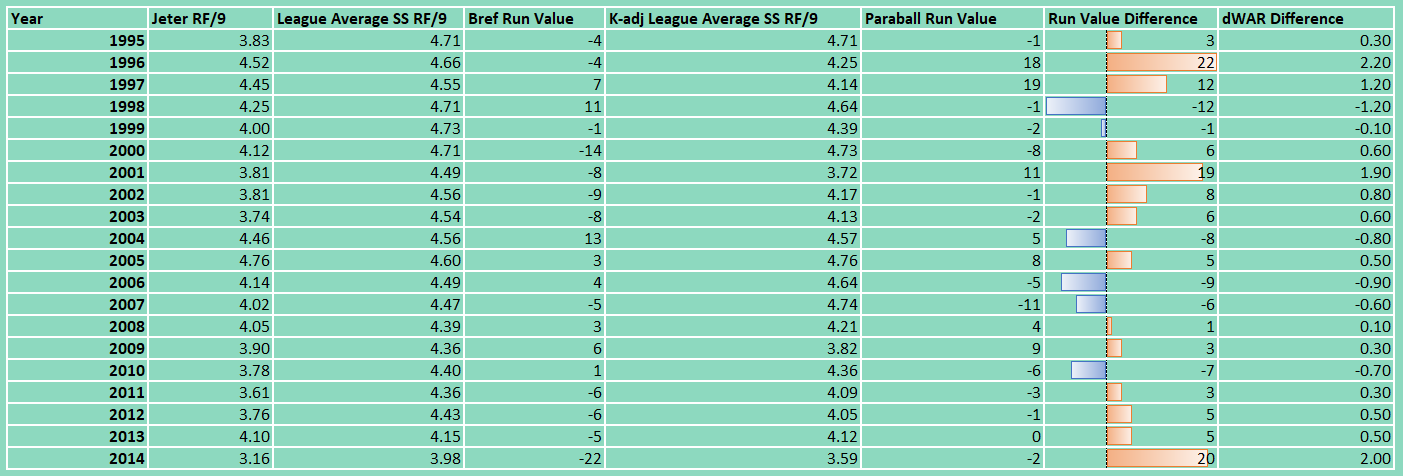
Table 1: Jeter’s RF/9, League Average SS RF/9, Baseball Reference Defensive Run Value, K-adj League Average SS RF/9, Paraball Defensive Run Value, Defensive Run Value Difference, and dWAR Difference
As you can see in Table 1, Jeter’s defense at SS compares much more favorably to the K-adjusted league average RF/9 than the standard league average RF/9, as his Yankees pitching staffs were able to strike out opposing batters at a rate 4.42% higher than the league average strikeout rate.
I also graphed Jeter’s Baseball Reference defensive run values and Paraball defensive run values against his age to see which run value metric more accurately tracks the expected age-related ability decline at the shortstop position.

Figure 1: Jeter’s Baseball Reference Defensive Run Values and Paraball Defensive Run Values. X-axis is age.
From Figure 1, we can clearly see that the Paraball run values are capturing a much larger percentage of the age-related decline trend than the Baseball Reference run values. Taking a look at the correlations, with r being the negative square root of R^2 in this case, r=-0.364 for the Paraball linear fit reveals a 54% stronger correlation than the r=-0.237 from the Baseball Reference linear fit. Removal of the variance that came from team strikeout percentage has greatly improved the accuracy in run value assignment.
Overall, Baseball Reference values Jeter at -9.4 wins defensively. Improved run value calculations show that Jeter’s true defensive value is closer to +3.0 wins. When we also account for his 73 games as a Designated Hitter, in which his dWAR is fixed at -0.7, we see that the more accurate estimation of Jeter’s dWAR as a shortstop is +3.7.
A more robust version of this analysis may include the correlation between strikeout pitchers and flyball pitchers. Since strikeout pitchers tend to also be flyball pitchers, Jeter’s high strikeout Yankees pitching staffs may have also been reducing his defensive chances by allowing opposing batters to hit the ball in the air quite frequently.
Conclusion
Incorporating team K% relative to league average K% can improve the defensive metrics of the pre-Statcast era significantly.
Jeter was an above average defender at shortstop over his 20-year career.