Comparing The Predictive Powers of xwFIP and FIP
Photo Credit: The Athletic
In my previous post, I introduced an enhanced version of FIP - named xwFIP - which incorporates batted ball data and 100% of plate appearances while remaining completely fielding independent. But how is xwFIP’s ability to predict future pitching success? Let’s have a look.
For my dataset, I used all 1466 pitchers in the Statcast era (since 2015) who pitched at least 50 innings in back-to-back seasons and computed their respective xwFIPs. Then I ran the linear regressions of ERA versus next season's ERA (Figure 1), FIP versus next season's ERA (Figure 2), and xwFIP versus next season's ERA (Figure 3).
Figure 1: Next Year ERA (y-axis) regressed against ERA (x-axis) for the 1466 pitchers with at least 50 IP in back to back seasons since 2015
Figure 2: Next Year ERA (y-axis) regressed against FIP (x-axis) for the 1466 pitchers with at least 50 IP in back to back seasons since 2015
Figure 3: Next Year ERA (y-axis) regressed against xwFIP (x-axis) for the 1466 pitchers with at least 50 IP in back to back seasons since 2015
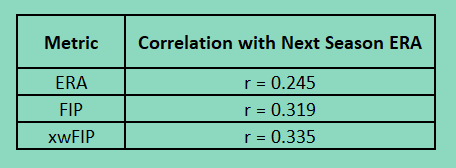
As evident from the charts above, FIP serves as a better predictor of next season ERA than ERA does, but xwFIP serves as an even better predictor of next season ERA than FIP does. We can see why this is from studying the correlations of the respective regressions, listed in Table 1 below.
Table 1: Correlations between each of ERA, FIP, and xwFIP and Next Season ERA
The improvement in predictive power when switching from ERA to FIP is a correlation boost of 0.074. Furthermore, the improvement in predictive power when switching from FIP to xwFIP is a correlation boost of 0.016.


