A Relative Value Comparison of Goal Scorers and Goalies in Hockey
Photo Credit: Bob DeChiara/USA TODAY Sports
Conventional hockey wisdom puts the goalie as the most important player on the ice, akin to the quarterback in football or the point guard in basketball. In my first hockey analysis for The Paraball Notes, I’ll evaluate the NHL’s goalies and goal scorers to determine at which points in the player value distribution this conventional wisdom holds true. My ultimate objective is to find the relative value of goal scorers versus goalies.
First, let’s take a look at the top and bottom ranked goal scorers and goalies in the 2023-24 season (through March 12). Both skaters and goalies in this analysis are ranked by Goals Above Average (GAA). For skaters, GAA is calculated by subtracting the expected number of goals scored by the shooter (shots * league average shooting percentage of 10.1%) from the actual number of goals scored. For goalies, GAA is calculated by subtracting the actual goals allowed by the goalie from the expected number of goals allowed (shots against * league average save percentage of 90.4%). It’s worth noting that a “shot” in hockey is only counted as a shot if the puck would have gone into the goal without a save by the goalie, otherwise known as a shot on goal.
Table 1 below ranks the top 30 shooters in the NHL based on their GAA.
Table 1: Top 30 shooters in the NHL
Sam Reinhart and Auston Matthews top the list of the most effective shooters in the NHL. Interestingly, Matthews has taken the fourth most shots in the NHL, but Reinhart ranks 47th in shots taken - a testament to his incredible shooting accuracy of 25.8%, which is 4.7% higher than any other shooter with at least 100 shots.
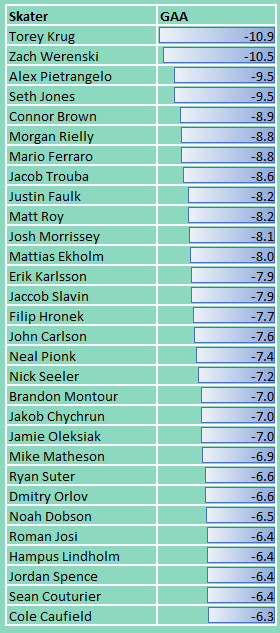
Table 2 lists the bottom 30 shooters in the NFL based on their GAA.
Table 2: Bottom 30 shooters in the NHL
Torey Krug and Zach Werenski are at the bottom of the shot effectiveness leaderboard. Krug ranks 123rd in shots taken, with 853 shots, and has a shooting percentage of 2.2%, while Werenski ranks 110th in shots taken and has a shooting percentage of 2.8%.
Table 3 ranks the top 30 goalies in the NFL, based on their GAA.
Table 3: Top 30 goalies in the NHL
Connor Hellebuyck is head and shoulders above the rest of the goalies in the NHL, worth 25.3 goals above average with a stellar 92.2% save percentage.
Table 4 shows the bottom 30 goalies in the NHL.
Table 4: Bottom 30 goalies in the NHL
Arvid Söderblom and Joonas Korpisalo have struggled in the goal this season, with save percentages of just 87.9% and 88.9%, respectively.
Now, let’s compare the shooters and goalies. Figure 1 illustrates the relative value of the shooters and goalies, with the y-axis being the GAA and the x-axis stating percentile.
Figure 1a: Relative value of shooters. The y-axis is the GAA and the x-axis is percentile.
Figure 1b: Relative value of goalies. The y-axis is GAA and the x-axis is percentile.
This year there are 3 shooters that are worth more than 20 goals offensively and just one goalie. So, at the 99th percentile, shooters carry more impact than goalies. However, the value of shooters has a steeper drop off than the value of goalies. From the 98th percentile down to the 52nd percentile, goalies are more valuable than shooters.
How does this impact hockey roster construction? Choose the truly elite goal scorer over the truly elite goalie, but choose the above average goalie over the above average goal scorer.


